Unpacking the August 1 Tariff package: What it means for global trade
Tariff shifts drive investment pledges, but global trade flows weaken
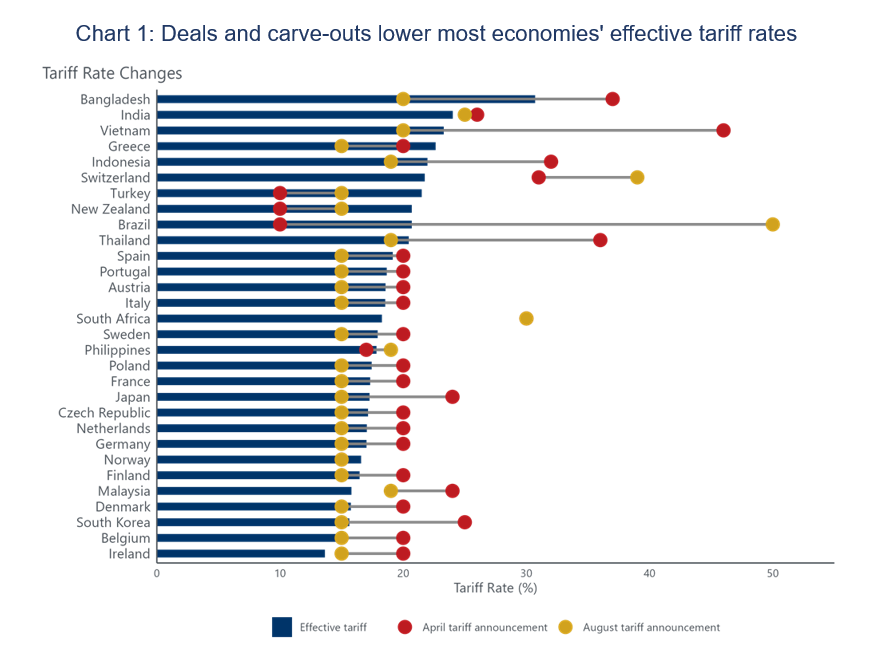
The August 1 tariff package locks in higher duties across a wide range of goods. While headline rates look severe, exemptions and carve-outs mean the effective US tariff rate now averages 18.2% – well above February levels, but lower than April’s ‘liberation day’ threat.
◼ To snag a deal with the US, many economies agreed to boost investment and ease market access
for US firms. Japan, South Korea, and Indonesia made large investment pledges, while others,
such as the EU and the Philippines, eased import barriers.
◼ Our daily tracker shows global seaborne trade volumes down 2.7% m/m in mid-August,
following a 2.3% fall in July. Shipments are 4.5% below April’s peak, with liquid bulk and break
bulk leading the declines.
◼ US seaborne imports have jumped sharply, as firms look to cheaper shipping options to offset
some of the tariff cost. This is not a reflection of improved US demand.
◼ After a strong first half, global trade will contract sharply through late-2025 and into 2026. By
2030, world trade volumes will remain around 5% below their pre-tariff path, with the US and
China absorbing the heaviest losses.