Global Economic Model
Build scenarios to understand the impact of economic shocks using the most robust, comprehensive, and timely world macroeconomic model workstation.
Request a demo
Overview
Our economic model provides a rigorous and consistent structure for forecasting and testing scenarios, addressing questions on a wide range of economic topics, such as the impact of oil price changes or the effects of slower growth in a major economy.
About the Global Economic Model
Fully integrated global model
Individual country models are fully linked through global assumptions about trade volume and prices, competitiveness, capital flows, interest and exchange rates, and commodity prices.
Bi-monthly updates
Twice a month clients receive all the latest economic data and our baseline forecast.
Comprehensive country coverage
The core model covers 87 countries in detail, plus the Eurozone. The rest of the world economy is covered in six trading blocs. Access complete coverage of our Global Economic Model here.
Simple-to-use software
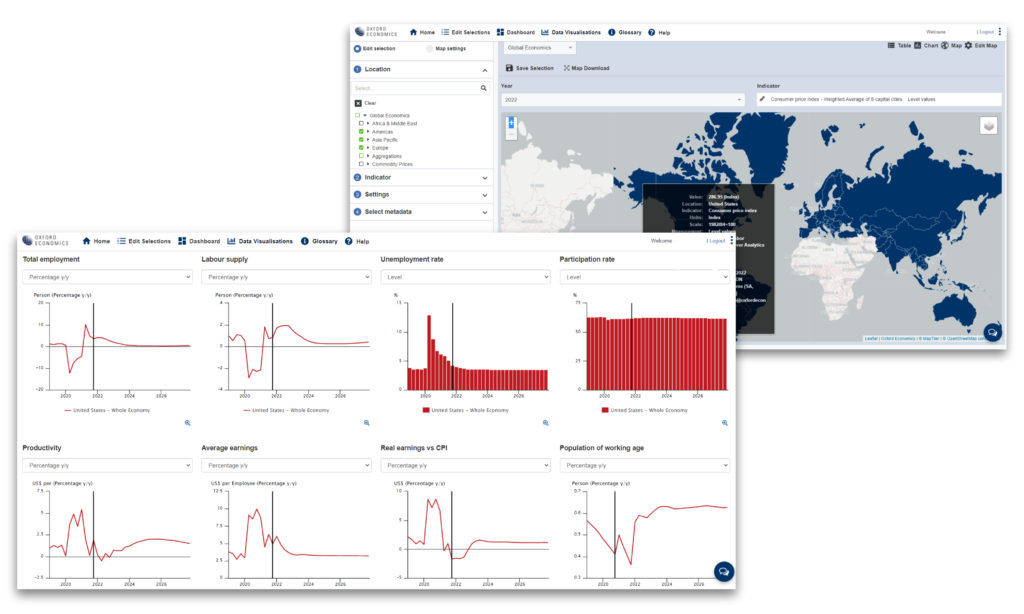
Quickly build scenarios, export data, load pre-defined scenarios, and present data as charts, heat maps and dashboards.
How we help your business

Comprehensive training and support
We provide clients with in-house and online training and also offer regular webinars for Model users.

Service coverage
The only global model that fully integrates 87 global economies plus the Eurozone.

Global model extension and custom forecasts
Proxy models for 108 additional countries. Our models, forecasts, and datasets can be customised to fit the unique needs of your organisation.

Global Economic Model
Our Global Economic Model provides a rigorous and consistent structure for forecasting and testing scenarios. A globally integrated economic model, it can be used to address questions on a wide range of economic topics, such as the impact of oil price changes, or the effects of slower Chinese growth.
“To our knowledge the most robust, comprehensive, and timely world macroeconomic model is the Oxford Economics model. We tested multiple world models in 2011, Oxford towered above the competition. Bottom line, the Oxford Economics model is a mission-critical tool. Customer support and training is extensive, and the billing process is dramatically less painful compared to our other vendors.”
Resources and events

Research Briefing
US Key Themes 2026: Exceptionalism amid fragmentation

Research Briefing
Global Key themes 2026: Bullish on US despite AI bubble fears

Research Briefing
Industry key themes 2026: Industry will grow if you know where to look

Research Briefing
US Bifurcated ꟷ Economic backdrop deepens racial disparities

Event
AI boom, Deglobalisation and Fiscal Shifts

Event
Investment Strategy Conference

Event
Investment Strategy Conference

Event
Commercio globale, Debito USA, Fed e tassi

Russia invades Ukraine, damaging the global economy
Featured
Request a demo
If you would like to find out more about our models, please fill in the form. A member of the team will be in touch with you as soon as possible.
By submitting this form you agree to be contacted by Oxford Economics about its products and services. We will never share your details with third parties, and you can unsubscribe at any time.
Related services

Service
Global Industry Model
An integrated model covering 100 sectors across 77 countries and the Eurozone.
Find Out More
Service
Global Cities Service
Make decisions about market and investment strategies with historical data and forecasts for 1,000 of the world’s most important cities.
Find Out More
Service
Global Asset Manager Service
A complete solution for asset managers who require convenient access to high quality, market-relevant analysis on key global markets.
Find Out MoreTrusted By