Estimating Data Centre ‘Phantom Demand’
Surging data centre connection requests drive phantom demand for power
Key findings
- On the back of rapid growth in cloud services and surging ambitions for artificial intelligence, the Australian Energy Market Operator (AEMO) received 44 GW of data centre connection requests from Network Service Providers (NSPs) as part of the 2025 Inputs, Assumptions and Scenarios Report (IASR). In response, AEMO commissioned Oxford Economics to develop independent forecasts of electricity consumption by data centres in Australia. Since collecting this data over the first 6 months of 2025, the volume of enquiries made to NSPs has continued to grow.
- 6 in every 7 MWs of connection requests are estimated to be ‘phantom demand’. That is, they are not expected to materialise on the grid under AEMO’s Step Change scenario. Of the 44 GW of connection requests received in the 2025 IASR, only 6 GW of prospective project capacity is required to meet demand under AEMO’s Step Change scenario.
- Furthermore, data centres typically operate materially below requested capacity; the 6 GW of prospective projects likely to go ahead are expected to draw 2.8 GW from the grid at maturity.
Data centres are specialised facilities that house computing infrastructure used to process, manage, and store large volumes of digital data. Electricity demand from data centres has become a focal point for energy planners. The rapid growth of cloud services and the surge in artificial intelligence are reshaping expectations for future load on electricity networks. In Australia, NSPs have received a wave of connection requests from developers seeking to secure capacity for potential new facilities to be connected to the grid.
Connection requests provide a signal of prospective investment, but we don’t believe they are a reliable measure of the grid demand that will ultimately materialise. While additional capacity will be needed, Australia’s current volume of connection requests likely overstates the grid draw that new facilities will use.
Chart 1: Phantom demand is primarily driven by connection requests considered unlikely to hit the grid
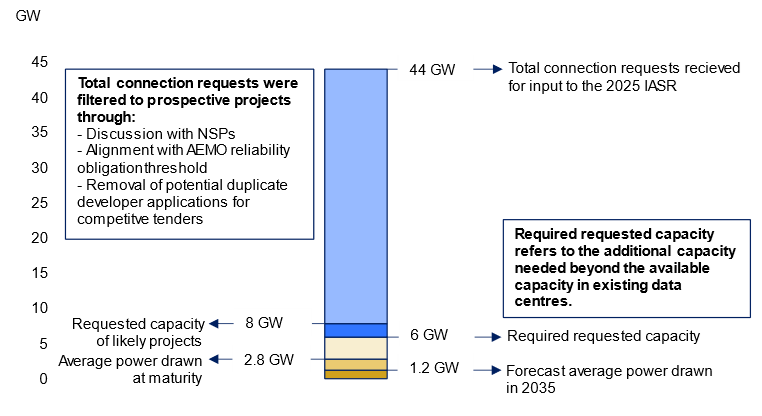
Source: Oxford Economics Australia, based on AEMO data
In FY25, AEMO estimates Australian data centres consumed 3.9 TWh, equivalent to a continuous average demand of 0.45 GW. The IEA places global energy consumption from data centres in 2024 at 415 TWh (47 GW). If Australia’s 44 GW of connection requests operated continuously at the requested capacity, they would approximate current global consumption, underscoring how much requests can overstate likely draw.
What drives phantom demand?
Two factors explain the difference between connection requests and the expected actual draw from data centres.
1. The removal of connection requests unlikely to proceed explains almost 90% of the difference between total connection requests and actual draw at maturity. Connection requests were screened by NSPs, AEMO and Oxford Economics when assessing the likelihood of a project being developed.
2. The gap between the requested capacity and data centres’ expected actual draw explains the rest. This is referred to as utilisation limitations.
Chart 2: Connection requests not linked to prospective projects
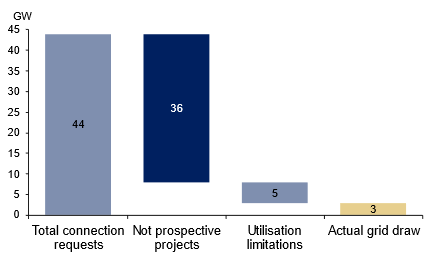
Source: Oxford Economics Australia, based on AEMO data
Requests unlikely to proceed
AEMO regularly updates its independent electricity demand forecasts in the IASR to support system planning of the National Electricity Market. These forecasts are divided into residential and business components, with the business category further split into data centres, hydrogen, large industrial loads, and the business mass market. Connection requests from large business users such as mines, smelters and data centres are modelled separately to better assess the likelihood of these projects proceeding, and to understand the implications for the grid.
To screen for data centre connection requests that were unlikely to proceed, three layers of filtering were applied.
First, AEMO engaged with the NSPs via surveys and follow-up discussions to determine the requests they felt were credible. These consultations indicated that 14 GW of connection requests were unlikely to proceed given the current supporting evidence (e.g., planning and environmental approvals, LIL/NSP survey responses).
Secondly, AEMOs’ reliability obligation thresholds for prospective large industrial loads were applied. The criteria for a connection request to be considered likely to proceed cover project and grid‑connection status, and supporting evidence. 1
Finally, for projects meeting these thresholds, duplicate requests were screened for. Where multiple data centre providers/developers each made an application request for what appeared to be an identical project as part of a proposal, project scoping or bidding process, only one of these was included in the prospective project list. For example, if a prospective tenant requested proposals to provide a 200 MW site in a specific region by a specific date and three providers/developers all submitted applications as part of their proposal process, one of these prospective projects was maintained in the list while the other two were excluded.
Together, NSP consultation, reliability obligation thresholds and duplicate removals reduced the initial 44 GW of requests to 7.9 GW of prospective projects deemed likely to proceed.
Utilisation limitations
Chart 3: Connection requests overstate the actual likely draw on the grid

Source: Oxford Economics Australia, based on AEMO data, IEA
Despite 7.9 GW of prospective projects being deemed likely to proceed, only 3.8 GW of energy is expected to be drawn from the grid at maturity if all prospective projects proceed.
Operating requirements during peak events and built-in redundancies required to guarantee uptime lead data centres to draw roughly half of their requested capacity.
Despite data centres having relatively continuous electricity consumption profiles, they can experience peaks in demand that range from 25% to 33% depending on data centre type. Connection requests necessarily reflect these peaks, not the average actual draw likely to be generated.
Furthermore, connection requests typically include a buffer above expected peak needs. Both these factors mean utilisation of the grid tends to be significantly below the potential draw on the grid.
Utilisation of requested capacity by data centre type was aligned with the International Energy Agency’s 2030 estimates2. The prospective mix of data centre types implies a utilisation of requested capacity of 48%, equivalent to an annual draw of 3.8 GW.
Chart 4: Utilisation factors
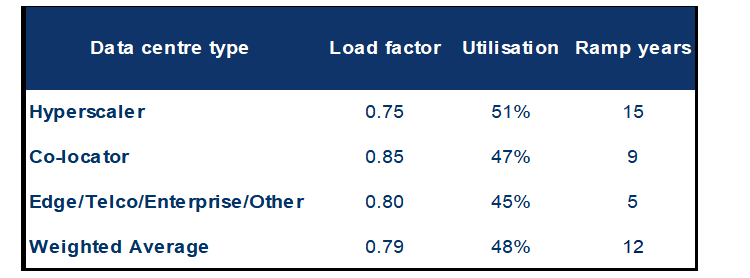
Source: Oxford Economics Australia, based on AEMO data
Current and prospective capacity
Data centres ramp to a mature consumption profile over time, with average ramp rates differing across hyperscalers (15 years), co-locators (9 years) and enterprise/edge/telco (5 years). AEMO metering data estimates existing data centres consumed 3.9 TWh in FY25 but have the capacity to consume 13 TWh at maturity, with some existing data centres expected to continue absorbing capacity to FY41.
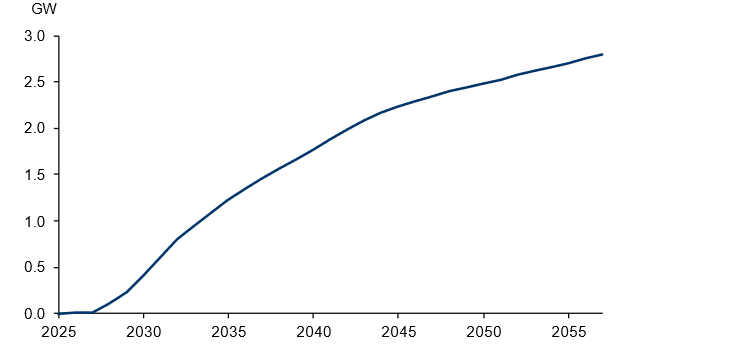
In the medium term, existing centres are expected to continue to account for the majority of actual draw. Prospective sites begin to take the lead in the mid-2030s, reflecting staggered construction and ramp rates of up to 15 years. These dynamics temper the initial actual draw from new builds.
Chart 5: Prospective data centre demand profiles mature in the mid-2030s
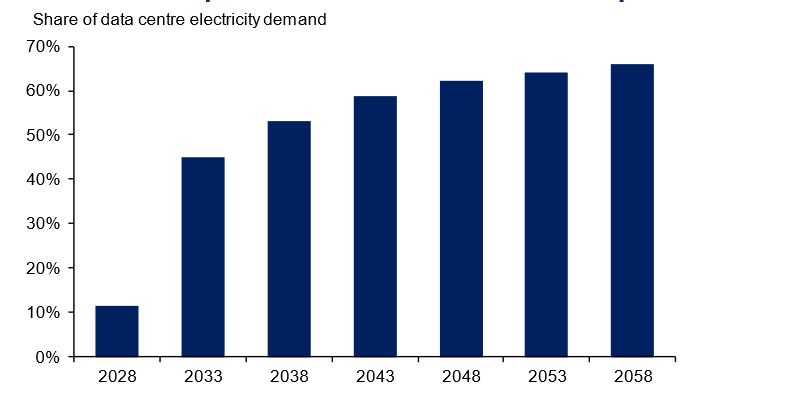
Source: Oxford Economics Australia, based on AEMO data
Estimates of existing data centre capacity at maturity (13 TWh) indicate that prospective facilities could consume the remaining 25 TWh of electricity annually by FY58 to meet growing demand for data centre services. This level of consumption equates to an average draw of about 2.8 GW, compared with the 3.8 GW capacity implied by utilisation factors for likely projects. This gap suggests some projects may operate below assumed utilisation, ramp up more gradually, or not proceed at all. An actual draw of 2.8 GW could be supported by approximately 6 GW of prospective project capacity to FY58. Additional capacity on the supply side is being developed to support the broader electrification of the economy. As of September 2025, AEMO reported 56 GW of generation and storage projects in the connections process, 7 GW of which are ramping up to full deployment, with current projects typically at this stage for less than 6 months, implying projects progress relatively briskly from this stage to full output.3
Chart 6: Prospective data centres’ actual electricity draw will ramp over time
Source: Oxford Economics Australia, based on AEMO data
Conclusion
Australia’s data centre pipeline appears far larger on paper than is likely to materialise in practice. Work by AEMO, the NSPs and Oxford Economics in filtering connection requests for likelihood to proceed and duplications reduces the 44 GW stock to a far smaller pool of prospective projects (7.9 GW). Even then, utilisation factors and the absorption capacity of existing facilities imply that only 6 GW of prospective projects may be required under AEMO’s Step Change scenario.
Much of the apparent demand is best characterised as phantom demand and reflects firms’ competing to capture future demand, rather than being a reliable guide to future consumption.
While electricity demand from data centres has a strong growth outlook, the evidence suggests that 6 in every 7 MW of connected requests can be characterised as ‘phantom demand’.
This research briefing was commissioned by AWS. The analysis and findings are Oxford Economics.
The experts behind the research
-
 Alex Hooper
Head of Climate & Energy Economics, OE Australia
Alex is a macroeconomist with over a decade of experience, she currently leads Oxford Economics' climate & energy economics practice.
-
 Hayden Toohey
Economist, Oxford Economics Australia
Hayden is an Economist in Oxford Economics’ climate & energy economics practice, specialising in energy-sector analysis, regional modelling, and scenario-based forecasting. He graduated with a Bachelor of Economics with First Class Honours from the University of Technology Sydney.
Get in touch
Learn more about this report or how our team could support you:
- Australian Energy Market Operator (2025), Forecasting Approach – Electricity Demand Forecasting Methodology. Available here ↩︎
- International Energy Agency (2025) Energy and AI. Available here ↩︎
- Australian Energy Market Operator (2025) NEM Connection scorecard – September 2025. Available here ↩︎