Data Sets
One-off economic data sets and analysis provided in Excel format.
Home > What we do > Consultancy > Data Sets
Organisations typically access our data via subscriptions to our databanks. However, many global and specialist consultancies and firms may also use our forecast data sets for relevant project work on a one-off basis. Our data sets demonstrate a high level of data granularity and allows the user to drill down the economic data to the needed extent.
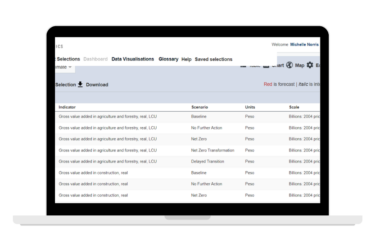
Delivered in Excel format, our economic data is compatible with business integration and visualisation tools, including Tableau and Microsoft PowerBI.
What sets our data apart
- Breadth and depth of coverage: 19 databanks with thousands of series and a high level of data granularity, with historical and forecast data for countries, industrial sectors, trade, cities, and tourism.
- World-class economic team: An in-house team of 160 economists, the largest economics team in the private sector, including macro, industrial, financial, labour and urban economists.
- Modelling expertise: Forecasts are produced using our suite of integrated country, industry, and city models, relied on by over 150 leading organisations around the world.
- Quantitative rigour: A long time leader in quantitative analysis, with over 30 years of experience conducting evidence-based research using the world’s only fully integrated global economic model.
- Consistency: Data and forecasts that are fully consistent with our widely respected global economic and industry views. All data are fully integrated and consistent across countries, sectors, and metros.
- Accuracy: Drawing on the most reliable, up-to-date data and leading-edge quantitative framework ensures the accuracy, and timeliness of our analysis.
GLOBAL MACRO DATA
COUNTRY DATA
Update frequency: monthly
Key indicators include:
- Consumer Price Index
- Employment
- Foreign exchange
- Consumption (Private and Government)
- Foreign Direct Investment
- Gross Domestic Product
- Export/Imports
- Commodity Prices
- Trade Balance
- Population (five-year age bands)
GLOBAL TRADE
Update Frequency: Quarterly
Trade by partner between 180 countries plus regions and aggregations:
- Total exports in US$, % of GDP, % of total exports
- Total imports in US$, % of GDP, and % of total imports
- Visible trade balance in US$ and % of GDP
Exports to other countries for 33 countries of:
- Food and live animals
- Beverages and tobacco
- Chemicals and related products
- Manufactured goods
- Mineral fuels, lubricants and related materials
- Animal and vegetable oils, fats and waxes
- Chemicals and related products
- Manufactured goods classified chiefly by material
- Machinery and transport equipment; miscellaneous
- Manufactured articles
- Commodities and transactions not classified elsewhere
GLOBAL INDUSTRY DATA
Our data is available for each country and demonstrate a high level of data granularity which allows the user to drill down the data for over 100 sectors and sub-sectors (organised by NACE level 2 codes) including 85 goods-producing industries, ten service sectors and other relevant series, such as car and truck production and registration, stock of cars on the road and investment in equipment other assets.
Time horizon: 1980 to 2040
Update frequency: Quarterly
Sectors covered:
- Aerospace
- Basic metals
- Chemicals
- Construction
- Consumer Goods
- Electronics & computers
- Energy & mining
- Engineering & metal goods
- Extraction
- Motor Vehicles
- Utilities
Key indicators include:
- Production, value-added output (Real, Local Currency, US$, % of World,% of GDP)
- Sales, gross output (Real LCU, Real US$, Normal LCU, Nominal US$)
- Investment (Real LCU, Nominal LCU, Real US$, Nominal US$)
- Employment
- Output prices
- Profits, all of the above by sector
CITIES AND REGIONS DATA
EUROPEAN CITIES
Time horizon: 1980 to 2030
Update frequency: Quarterly
Key indicators include:
- GDP and GVA by sector
- Workplace-based employment by sector
- ILO unemployment rate and level
- Population (total and working age)
- Household disposable income
- Retail sales
EUROPEAN CONSUMER SPENDING (COICOPS)
The service provides annual data and forecasts for over 40 ‘COICOP’ spending categories, including:
- Food
- Alcoholic beverages and tobacco
- Clothing and footwear
- Housing, water, electricity, gas and other fuels
- Health
- Transport
- Communications
- Education
- Restaurants and hotels
- Miscellaneous goods and services
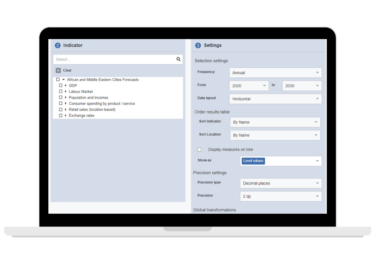
AFRICAN AND MIDDLE EASTERN CITIES
Time horizon: 1980 to 2030
Update frequency: Quarterly
Key indicators:
- GDP
- Employment by sector for Primary (agriculture, forestry and fishing); Secondary (mining & quarrying, manufacturing, utilities, construction); Transport, storage, information & communications; Financial & business services; Consumer services (wholesale & retail trade, accommodation & food service activities, arts, entertainment & recreational services); Public services (public administration & defence; education, health & social work)
- Population
- Households and household income by category
- Consumer spending for goods and services
- Retail sales
ASIAN CITIES
Time horizon: 1980 to 2030
Update frequency: Quarterly
Series include:
- Gross Domestic Product
- Gross value added for key sectors
- Labour market
- Population
- Government consumption
- Household disposable incomes
- Investment
- Retail sales volume index (location-based)
- Retail sales (location-based)
CHINA CITIES
Time horizon: 1980 to 2030
Update frequency: Quarterly
Series include:
- Gross Domestic Product
- Gross value added for key sectors
- Labour market
- Population
- Government consumption
- Household disposable incomes
- Investment
- Retail sales volume index (location-based)
- Retail sales (location-based)
LATIN AMERICAN CITIES
Time horizon: 1980 to 2030
Update frequency: Quarterly
Series include:
- GDP
- Value added by industry
- Workplace employment by industry
- Labour force, unemployment; population (total and working age)
- Household incomes and spending, where available
NORTH AMERICAN METROS
Time horizon: 1980 to 2030
Update frequency: Quarterly
Series include:
- Income
- Retail sales
- GDP
- Employment by sector
- Consumer spending
- Household income bands
- Housing starts and permits
UK REGIONS
Time horizon: 1980 to 2030
Update frequency: Quarterly
Series include:
- Demographics
- Labour market
- GVA
- Occupations
- Housing
- Unemployment
- Residence employment
- ILO employment
- Income
UK LOCAL AUTHORITY DISTRICTS
Time horizon: 1980 to 2030
Update frequency: Quarterly
Series include:
- Population
- Income and spending
- Workplace-based employment by sector
- GVA by sector
TRAVEL AND TOURISM
GLOBAL TOURISM FORECASTS
Time horizon: 1988 to 2026
Update frequency: Quarterly
Series include:
- Economic drivers
- Prices
- Demographics
- Travel spending
- Industry performance
- International visits
AIR TRAVEL FORECASTS
Time horizon: 2006 to 2035
Update frequency: Semi-annual
Forecast series covered:
- Summary passenger flows: total passengers,domestic passengers, international passengers
- Economic drivers: GDP, real US$; GDP per capita, real USD; Population, total; % middle class households; Exchange rate, US$, Exchange rate, weighted average index; International split of passenger flows by short, medium, long, and ultra-long-haul
CITY TRAVEL DATA
Time horizon: 2000 to 2026
Update frequency: Quarterly
Forecast series covered:
- Total overnight visits and nights for each city , with detail on the proportion using paid accommodation
- Measurement of visits and nights to 300 destination cities from each of the top 50 origin countries, from each world region, and domestic markets
- Number of departures from 300 origin cities to each of 50 destination countries and to each world region on a visits and nights basis
- Total inbound/outbound travel spending for each city
- Topline economic and demographic indicators for each city