


Global Construction Service
Concrete intelligence for the construction industry
80+
Countries covered
90%+
Construction activity represented
2050
Forecast horizon
Overview
Construction markets are increasingly being shaped by macroeconomic volatility, shifting policy priorities, and long-term structural forces such as urbanisation, the energy transition, and demographic change. Navigating these dynamics with confidence requires verified data, rigorous forecasting, and deep sector expertise.
The Global Construction Service delivers all three: covering over 80 key markets across regional, national, and subnational levels and representing over 90% of total global construction activity, all within a single, consistent analytical framework.
What’s included?
Drawing on Oxford Economics’ global modelling capabilities, specialist construction expertise and project-level intelligence, the Global Construction Service provides a forward-looking view of construction activity and the economic and market forces shaping the outlook.
Global construction data and forecasts
Access quarterly forecasts of construction activity to 2050. Underpinned by the Global Economic Model, our forecasts reflect the impact of economic outlook, investment cycles, policy initiatives, inflation, interest rates and long-term trends on construction activity.
- Macroeconomic and construction forecasts for more than 80 countries, with historical data dating back to 2010 and forecasts extending to 2050.
- Building commencements in both value and floor area terms for the world’s 25 largest construction markets.
- Global Construction Outlook Dashboard to compare growth across countries and sectors, and visualise new construction, renovation and commencement trends in key markets.
Sectors we cover
- Residential: Single-family and multi-family dwellings
- Non-residential: Offices, hotels, retail, factories, warehouses, agricultural, educational, health, other non-residential buildings
- Civil engineering: Roads, railways, ports, electricity, water and sewerage, telecommunications, other civil engineering
Work done value forecasts
Our forecasts are based on work done value, also known as value put in place. Work done value reflects how activity and expenditure flow through the market over time, particularly for large, multi-year projects. As a result, it provides a more meaningful basis for mapping your revenue exposure as well as supporting sales, investment and capacity planning.
Global construction reports and analysis
Our construction economists provide regular, independent analysis to help you understand what’s changing in construction markets and its implications for the construction outlook.
- Country Construction Reports: Quarterly reports providing detailed economic, demographic and construction outlooks for major construction markets and reasons for forecast revisions.
- Quarterly chartbooks: Top level summaries of global and regional construction outlook and sectoral performance.
- Research Briefings: Event-driven and thematic analysis on emerging issues in construction, from cost escalation and infrastructure investment to data centre demand.
Global construction project tracking
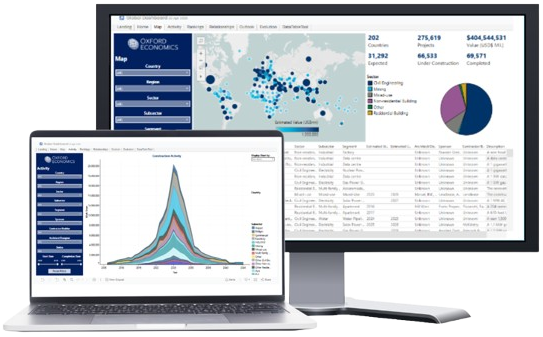
We track 270,000 construction projects across over 200 countries and 70+ market segments. Project-level data includes project value, location, start and completion dates, status, sponsor, contractor, architect and project descriptions. Use our dashboard to explore project pipelines and inform market sizing and competitor analysis.
- Market activity monitoring: Track construction projects across more than 200 countries to identify new opportunities and relationships.
- Subsector-level tracking: Identify projects across more than 70 segments of the market, including build-to-rent, data centers, solar power, and defence.
- City-level tracking: Understand where construction is happening across countries by identifying active projects in each city and state.
- Monthly refresh: Data updated each month, ensuring you have access to the latest project announcements.
- Dashboard visualisation tools: Geographic dashboards let you map activity, identify hotspots, and compare market momentum across countries and regions at a glance.
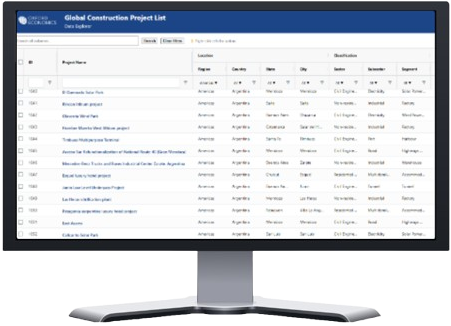
- Online database: Search and filter projects, and download the information you need directly to csv.
Economist support
- Direct access to Oxford Economics’ construction economists for questions regarding our forecasts, methodology and market development.
- Regular webinars provide additional opportunities to explore key trends and discuss the issues shaping construction markets.

Why Oxford Economics
Construction markets evolve over long investment and planning cycles, making a reliable forward view essential for organisations deciding where to focus resources and position for future growth. Oxford Economics combines long-term construction forecasts, economic modelling and specialist expertise to provide that perspective.

Construction intelligence backed by economic rigour
Our construction outlook combines Oxford Economics’ global modelling capabilities with specialist construction expertise and project-level intelligence, capturing both market-specific developments and the wider economic, demographic, policy and investment forces shaping construction activity.

Proprietary construction forecasts
We forecast construction activity on a work-done basis, measuring the value of construction completed over time rather than relying solely on project starts or pipeline values. This creates a more consistent measure of how construction activity actually flows through the market.

Consistent, long-term forecasting across markets
Our forecasts use a common methodology across countries, sectors and subsectors and extend to 2050, giving clients a comparable view of construction activity well beyond the current project pipeline.

Economist support
Clients can engage directly with our construction economists to ask questions about the outlook, forecasts and methodology, adding expert context and nuance beyond the numbers.
Benefits
- Compare growth opportunities across countries, sectors and subsectors using consistent construction forecasts.
- Inform investment and capacity planning with the expected scale and timing of construction activity across key markets.
- Support strategic and commercial decisions with independent forecasts, verified data and expert analysis.
- Understand what is driving the outlook by assessing how economic conditions, policy and investment trends are shaping future construction activity.
- Gain a more complete view of construction markets by combining long-term market forecasts with near-term project intelligence.
What’s included?
Construction forecasts tell you where markets are heading. Project tracking gives you the ground-level evidence to validate those signals and monitor how activity is evolving across sectors and regions in near real time.
Global construction data and forecasts
Our forecasts are underpinned by Oxford Economics’ Global Economic Model, ensuring they consistently reflect the broader macroeconomic and demographic environment, including the investment cycles, interest rates, government budget positions, population growth, cost escalation, and employment trends that shape construction activity.
- Updated quarterly
- Forecasts to 2050
- Over 80 key construction markets
- Regional, national, and subnational
- 90%+ of global construction activity
- Residential, non-residential, and civil engineering
- Quarterly updates: The service is refreshed every quarter, drawing on our baseline macroeconomic forecasts for the global economies.
- Construction forecasts: We provide forecasts covering over 80 key construction markets with full historical data.
- Granular forecasts: Historical data and forecasts to 2050 for each subsector by construction type, for both publicly and privately funded activity.
- Geographic coverage: Our database spans over 80 key markets on regional, national, and subnational levels, representing over 90% of global construction activity.
- Detailed segmentation: Forecasts available by construction type: residential (single and multi-family), non-residential (commercial, industrial, and social), and civil engineering (roads, transportation, and utilities).
Global construction reports and analysis
Our construction economists deliver independent analysis to help you navigate the evolving global construction landscape and make informed, data-driven decisions.
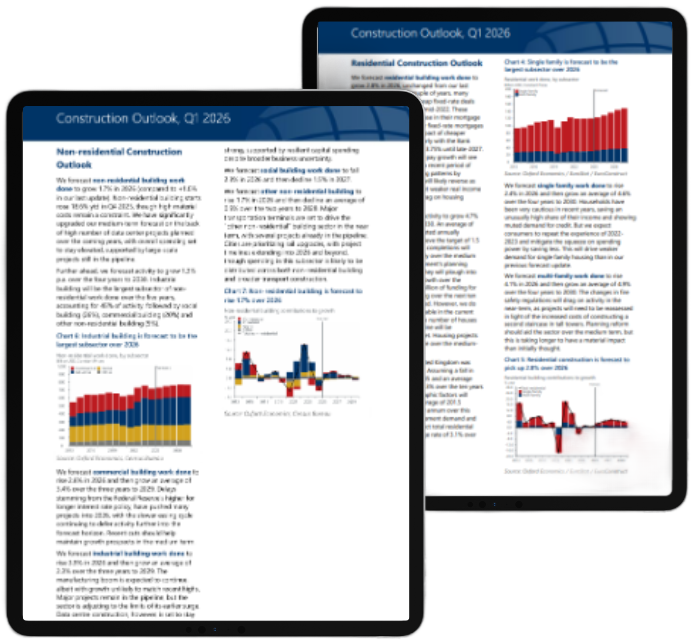
- Global Construction Outlook: A quarterly report highlighting key forecast narratives and changes to the outlook.
- Country Reports: Country and regional-level updates in a concise, standardised format.
- Research Briefings: Thematic analysis on key trends shaping construction markets, from demographics and AI to construction costs and climate transition risk.
- Quarterly Chartbook: A visual executive summary of key forecasts, highlighting macroeconomic drivers, regional shifts, and sectoral performance.
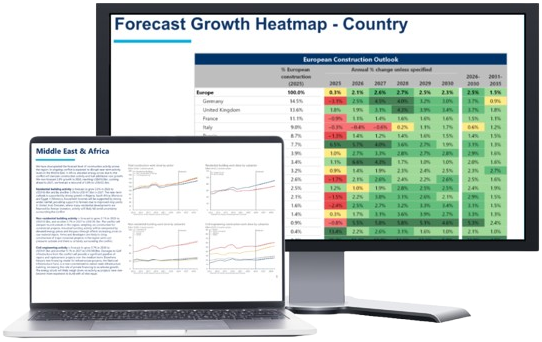
- Quarterly updates and chartbook: The service is refreshed quarterly, combining Oxford Economics’ award-winning global macroeconomic and industry forecasts. Each update is accompanied by a chartbook, offering a clear, visual summary of key construction trends and forecast highlights.
- Construction—overview: Sample quarterly chartbook and report covering global construction trends, forecast highlights, and regional analysis.
- Advanced analytical tools: Our web-based databank empowers users to build custom queries and access data in multiple formats, underpinned by detailed macroeconomic assumptions and both real and nominal construction values.
Platform and tools
Our Global Construction platform makes it easy to access, analyse, and apply industry-leading forecasts directly into your planning and reporting workflows.
- APIs
- Datafeed
- Excel plug-in
- Power BI dashboards
- Web-based databank
- Databank access: Our web-based databank allows you to build custom queries and download data in multiple formats, underpinned by consistent macroeconomic assumptions and detailed real and nominal construction values.
- Interactive dashboards: Through our Power BI dashboards, users can visualise trends, compare countries and sectors, and monitor key indicators in just a few clicks, helping identify growth hotspots and evolving market dynamics.
- Webinars and insights: Regular, globally focused webinars that explore the major themes shaping the construction landscape, from infrastructure investment and housing demand to supply chain challenges and cost pressures.
- Research resources: Our research portal and AI Assistant help you navigate analysis efficiently, extract narratives, and integrate key insights into your reports and presentations.
- Expert support: Our global team of over 20 subject matter experts provides direct access to timely guidance and tailored insights from our forecasts and data.
Global construction project tracking
Construction forecasts tell you where markets are heading. Project tracking gives you the ground-level evidence to validate those signals and monitor how activity is evolving across sectors and regions in near real time.
- 200+ markets covered
- National, state/provide, and cities
- Monthly refresh
- Economist support included
- Over 70 segments of the construction market
- Embedded visualisation dashboard
- Online database to easily search and extract data
- Market activity monitoring: Track construction projects across more than 200 countries to identify new opportunities and relationships.
- Subsector-level tracking: Identify projects across more than 70 segments of the market, including build-to-rent, data centers, solar power, and defence.
- City-level tracking: Understand where construction is happening across countries by identifying active projects in each city and state.
- Monthly refresh: Data updated each month, ensuring you have access to the latest project announcements.
- Power BI visualisation: Geographic dashboards let you map activity, identify hotspots, and compare market momentum across countries and regions at a glance.
- Online database: Search and filter projects, and download the information you need directly to csv.
- Economist support: Expert context from our team of over 20 construction economists, ready to interpret activity trends and what they mean for your markets.
Latest insights







Testimonials
Oxford Economics is synonymous with high quality macroeconomic research. A compelling reason for us to subscribe to its Real Estate Economics Service.

The Real Estate Economics Service allows us to link the top-down economic outlook, drivers and risks, with our market-level forecasting and return expectation setting. This allows us to be more strategic about our allocations and how to build & maintain a well-diversified portfolio.

As an active international lender for commercial real estate, the expansion of Oxford Economics’s Real Estate Economics Service to include analysis and forecasting of real estate markets is a real gain and represents an addition to the comprehensive service we have been benefitting from for many years

For Transwestern’s asset services, investment management and development businesses, we depend on economic inputs and editorial content that are rational and insightful to inform our decisions. Oxford Economics delivers.

CMHC’s Stress Testing and ORSA team has started using Oxford Economics for the purpose of Stress-Testing. Our experience has been very positive. The software is sound, intuitive and user friendly. But most of all, it allows the user to understand the links between the variables and for a certain degree of customization. We have also contracted OE to help us design Stress-Test scenarios.
Request a free trial
Complete the form and we will contact you to set up your free trial. Please note that trials are only available for qualified users.
We are committed to protecting your right to privacy and ensuring the privacy and security of your personal information. We will not share your personal information with other individuals or organisations without your permission.