

What the CMIP7 update means for our Global Climate Scenarios

The new CMIP7 scenarios feature a narrower range of temperature increases by 2100 which include a lower plausible worst outcome. At the same time, the scenario set no longer includes an emissions pathway which limits warming to 1.5°C without overshooting.
It does not warrant significant changes to our scenarios for now, but we will review our assumptions after the next NGFS update.
CMIP7 emissions scenarios
Climate modelling groups have released a new set of emissions scenarios in the latest phase of the Coupled Model Intercomparison Project (CMIP). These ‘CMIP7’ scenarios will be used in the next Intergovernmental Panel on Climate Change (IPCC)’s assessment report (AR7) as evidence for future climate outcomes and replace the CMIP6 scenarios which were the basis of the IPCC’s previous report (AR6).
The CMIP7 pathways reflect the scientific community’s latest assessment of global technological and socio-economic developments. For financial institutions working to frameworks aligning to the Network for Greening the Financial System (NGFS), the update could have significant implications for their stress-testing exercises if the NGFS aligns its own scenarios accordingly. It could also impact corporates who use the CMIP7 scenarios for strategic planning and reporting purposes.
The new scenarios – what’s changed?
First, the range of central estimates of the temperature increase by 2100 in the scenarios has narrowed, from 1.5°C-4.7°C in the CMIP6 scenario set to 1.6°C-3.3°C in the new one.
Chart 1: Comparing the CMIP7 and CMIP6 scenarios
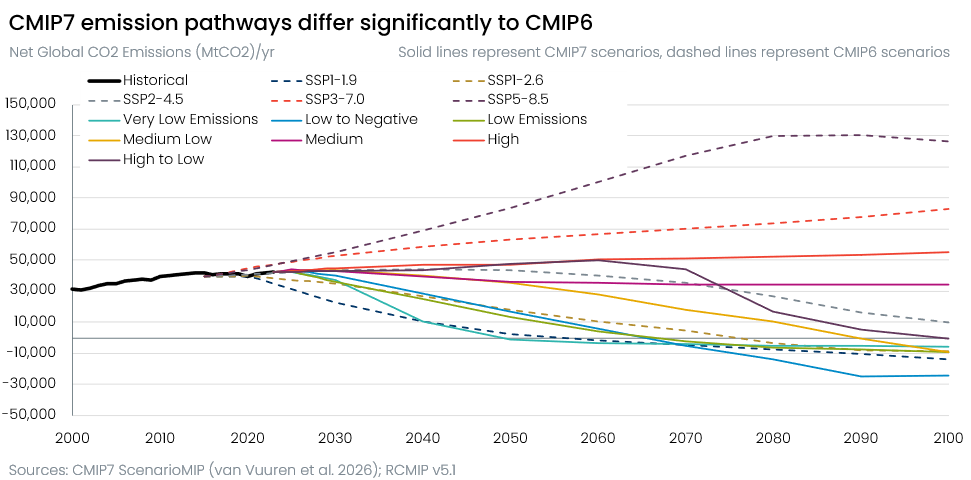
For the first time in four model generations, the upper bound of the 2100 warming estimate has been reduced. Climate scientists no longer believe that even a deliberate rollback of current climate policy would plausibly produce the coal-intensive 4.5°C-5°C warmer world that the previous worst-case scenario (RCP8.5) implied. This is due to the falling cost of renewables, the plateauing of global coal demand, and over $2tn of annual clean-energy investment.
Although the latest economic developments inform the CMIP7 scenarios, uncertainty remains around future emission trajectories and the sensitivity of the climate system to these emission pathways. As a result, high-emission pathways are still useful for assessing the impact of high-warming outcomes, but they should be considered low-probability tail-risk events that are useful for stress-testing purposes.
At the other end of the emissions set, the 2100 temperature in the lowest emission scenario has increased. The rapid reduction in emissions in the 2020s that the CMIP6 scenarios assumed hasn’t materialised. The new scenario set implies that the world can no longer realistically avoid overshooting the Paris Agreement’s 1.5°C goal, even in the best case. Moreover, the low-emission scenarios assume a heavy reliance on large-scale carbon removal, which remains a nascent technology.
Second, instead of comparing against a “no climate-policy baseline”, the new “medium” scenario incorporates climate policies that have been implemented. This more accurate benchmark scenario allows for a better comparison against future policy weakening or strengthening and represents a significant improvement from the CMIP6 scenarios. In line with this, we’re conducting a review of our own baseline climate assumptions to include comprehensive coverage of macro-relevant current policies, which we expect to complete in H1 2027.
Notably, the CMIP7 scenario names no longer reference the SSP and radiative forcing level (the approximate additional warming pressure on the climate system) and, instead, they are based on their emissions trajectories, which range from “high” to “low-to-negative”, to make them clearer and easier to understand.
How do Oxford Economics’ climate scenarios compare?
We produce five long-term and two short-term narrative-driven climate scenarios, which we update on a quarterly basis. Four are aligned to the NGFS. Corporates and financial institutions use these scenarios for stress testing, strategic planning, and climate reporting. Our long-term scenarios have a temperature warming range of 1.5°C-4.5°C by 2100.
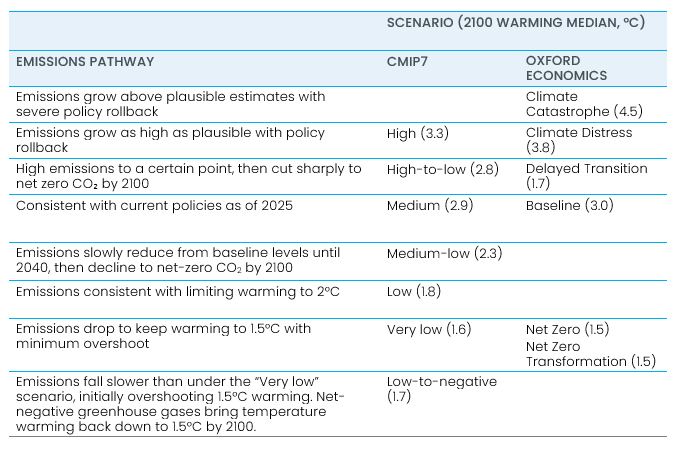
Table 1: Comparing our scenarios with the CMIP7 pathways
Sources: CMIP7, Oxford Economics
Table 1 shows how our scenarios align with the emissions pathways of the CMIP7 scenarios. Our “Net Zero” scenario now reaches a lower temperature than in the CMIP7 equivalent “Very low” scenario. In comparison, our net zero assumptions rely less heavily on technological improvements for increased carbon removal capacity and instead assume greater shifts in demand to limit warming to 1.5°C by the end of the century. We believe that carbon management approaches will play an important but limited role in climate mitigation and cannot substitute deep emissions reductions. A full Research Briefing on this topic can be found here.
At the other end of the spectrum, we abstain from discounting our high emissions scenarios (“Climate Catastrophe” and “Climate Distress”) as they still provide a useful basis for stress-testing tail-risk outcomes in the event of the world reaching a tipping point or policy failure. We believe scenario testing and strategic planning both above and below the ‘current policies’ baseline is appropriate for financial institutions and businesses.
We will revisit our scenario narratives and assumptions when the NGFS publishes its next long-term scenario update before the end of the year to ensure they remain compatible with our clients’ disclosure and risk assessment needs. At this stage, we do not believe the CMIP7 update warrants significant changes to our suite of scenarios, but it may inform the methodology we are developing for assigning scenario probabilities.