OE Logo
Ungated Post|7 August 2020

US Recovery Tracker reveals a fragile economy

US Recovery Tracker reveals a fragile economy
  • Our Recovery Tracker fell 0.7ppts to 76.5 in the week ended July 24. Four of the tracker’s six sub-categories declined, with the health index leading the way lower. Risks remain clearly tilted to the downside as more than 60,000 new Covid-19 cases were recorded per day and the economy eagerly awaits another virus relief package.
  • Four months after the CARES Act was signed into law, multiple dimensions of the recovery now look constrained. With a health solution still out of reach and the rebound looking fragile, fiscal stimulus is urgently needed to prevent the economy from sliding back into a downturn. Lawmakers can mitigate unnecessary damage by striking a new stimulus before their August recess.

US Recovery Tracker reveals a fragile economy 1

US Recovery Tracker reveals a fragile economy 2

Read more

In 2019, RB directly employed 3,933 people at 21 operational sites in the US. RB’s full (direct, indirect, and induced) 2019 economic impact in the US totaled $3.8 billion and more than 25,000 jobs.

Ungated Post|31 July 2020

US Recovery Tracker – the economy needs a booster shot

US Recovery Tracker – the economy needs a booster shot
  • Our Recovery Tracker rebounded slightly in the week ended July 17, rising 0.6ppts to 76.9. While the small weekly gain is no doubt encouraging, demand and employment – key pillars to this recovery – are showing some worrying fissures just as Congress is debating (and delaying) additional fiscal aid
  • After a very rapid first phase of the recovery, the economy has entered the second rehabilitation phase with much less momentum and a dire need for further fiscal support. As Federal Reserve Chair Jerome Powell stressed at the FOMC press conference, policymakers should make it a priority to address the mismanaged health crisis and provide indispensable fiscal aid to the most vulnerable segments of the economy

us recovery tracker 1

us recovery tracker 2

Read more

Oxford Economics and SAP surveyed 2,000 executives from small and midsize organisations about their priorities, challenges, and digital maturity.

Oxford Economics worked with Google Cloud to survey 1,000 CIOs around the world, in seven industries about the ways they partner with other organisations: to meet business goals, and about the technologies they rely on to make those partnerships productive and valuable.

Ungated Post|31 July 2020

Chart of the week: US coronavirus reproduction rates

Innes McFee
Innes McFee
CEO
Chart of the week: US coronavirus reproduction rates

Latest data reveal a shifting US health picture. Coronavirus reproduction rates slowed in the last week after the pause or rollback of state and local reopenings. As of last week, coronavirus was spreading quickly in 29 states that account for about 40% of national GDP, down sharply from the prior week. While this is an encouraging sign but it is a rapidly changing situation and crucial to the strength of the recovery.

Read more

Ungated Post|24 July 2020

US Recovery Tracker shifts into reverse

US Recovery Tracker shifts into reverse
  • The foundations to this recovery are cracking under the weight of a mismanaged health crisis. Our Recovery Tracker fell for the third time in five weeks in the week ended July 10. The health index declined for the fourth consecutive week; demand fell for the second consecutive week, its largest decline in four months; and employment was unchanged.
  • While the rebounds in retail sales, employment, and industrial production through June were alluring, policymakers should not fall under the spell of rear-view-mirror economics. As of mid-July, the economy is emerging quite frail from its first rehabilitation phase, and the risks of a renewed downfall are real. More fiscal aid and adequate health policy are necessary to ensure a sustainable recovery in H2 2020.

recovery tracker 1-1

recovery tracker 2

Read more

Ungated Post|24 July 2020

Chart of the week: Our forecast for world trade growth

Innes McFee
Innes McFee
CEO
Chart of the week: Our forecast for world trade growth

Our baseline forecast looks for world trade to grow by just 2.6% per year from 2020-2030, with trade volumes in 2030 around 5% lower than we expected in January. In addition, we expect the next decade to see the lowest ratio of trade growth to GDP growth in any decade since 1950.

Read more

Oxford Economics was commissioned by the Department for Business, Energy and Industrial Strategy (BEIS), to assess the impact of public R&D support on levels of private R&D spending in the UK and other advanced economies.

trade-and-transport-margins-in-pharmaceuticals-and-other-r-and-d-intensive-industries-300px

Spending for prescription and over-the-counter pharmaceutical products totaled $413 billion in 2012 according to the Bureau of Economic Analysis’ (BEA) trade and transports margin data. Just over half of this spending (52%) accrued to the pharmaceutical companies that produced the medicines, while the remainder was divided between transport and wholesale margins (21%) and retail margins (26%).

Ungated Post|9 July 2020

Infographic: 10 Top Coronavirus Calls

Infographic: 10 Top Coronavirus Calls

2020 has undoubtedly been a challenging year for forecasters, but in spite of this, the accuracy of our analysis has remained consistent. Here are our picks of the top calls we have made this year.

Read more

A new report by Oxford Economics sheds light on the potential costs of restricting competition in the provision of 5G network equipment across 31 European countries. The study models the consequences for investment costs, rollout delays, and long-term productivity losses in the EU-27 countries plus Iceland, Norway, Switzerland, and the United Kingdom.

SHRM (Society for Human Resource Management) and Oxford Economics are partnering to help business and government leaders better understand the impact of the novel coronavirus on the US workforce and business operations by surveying employers. The latest snapshot provides insight into the dynamics of state re-openings on employment in the United States.

This report explores the short-term effects of Covid-19 on the financial sustainability of the creative industries in the UK.

This report examines the evidence so far on the impact of the COVID-19 outbreak on the food industry and supply chain across the Asia-Pacific region. The paper marks the first in a three-paper series looking at the issue, and covers early evidence on latest trade flows, price reactions, and government policy responses.

The latest COVID-19 Business Index released by SHRM (Society for Human Resource Management) and Oxford Economics suggests that the U.S. economy could be nearing the bottom of its downturn. The survey found more employers are hiring salaried workers than laying off or furloughing them, and that these gains are long-term, not short-term. Still strength in the hospitality and restaurant sector was offset by continued weakness in other sectors such as government and education.

$1.3 trillion in annualized income has been lost by workers across the United States, according to new data from Oxford Economics and SHRM, based on a survey of HR professionals in the US conducted between April 27 and May 1. Of this $1.3 trillion, 20% represents earnings reductions among those fortunate enough to still have jobs. In addition to rising unemployment, declining income among those still working will likely provide further downward pressure on economic growth.

Ungated Post|19 May 2020

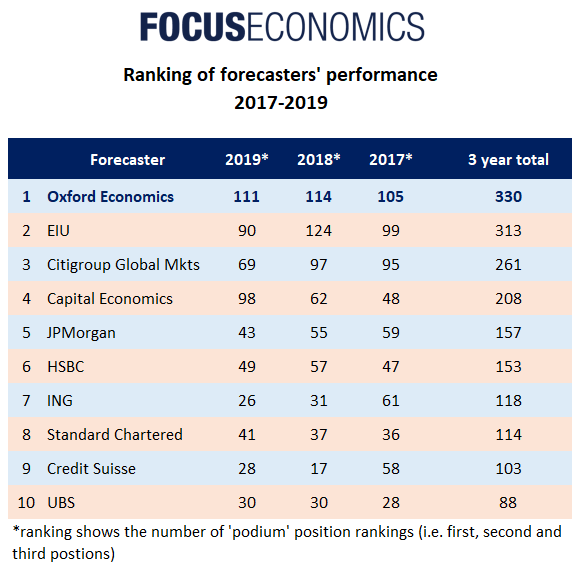
FocusEconomics ‘Best Economic Forecaster Awards’ ranks Oxford Economics top most consistently over last 3 years

FocusEconomics ‘Best Economic Forecaster Awards’ ranks Oxford Economics top most consistently over last 3 years

Focus Awards 2020Oxford Economics is proud to announce that it has been ranked top in FocusEconomics’ Best Economic Forecaster Awards more than any other forecaster over the past three years. 

Read more

The Ottawa Declaration Working Group commissioned Oxford Economics to undertake a national study looking at the value of Galleries, Libraries, Archives and Museums (GLAMs) in Canada.

washington, united states
Ungated Post|14 May 2020

US Cities, Metro and Counties Outlook 2017 – 2021

US Cities, Metro and Counties Outlook  2017 – 2021


A well-functioning, modern infrastructure is central to economic development and to quality of life. From the roads and railways needed to transport people and goods, to the power plants and communications networks that underpin economic and household activity, to the basic human need for clean water and sanitation, infrastructure matters to people and businesses everywhere.

However, there have been relatively few attempts to track and monitor infrastructure investment across countries and sectors. This has made it difficult to predict how, where and when investment is most needed.

Read more