New data shows considerable variation of sectoral energy intensity

A remarkably consistent fact of energy usage across economies, industries, and energy types is that intensity has come down steeply in recent decades. In other words, the amount of energy required to conduct a given amount of economic activity has fallen.
At the economy-wide level, this can happen due to the shifting composition of economic activity over time. For instance, the UK’s transition away from an industrialised economy towards a service-based one has brought down its economy-wide energy intensity, owing to the shift from high to low energy-intensive economic activity.
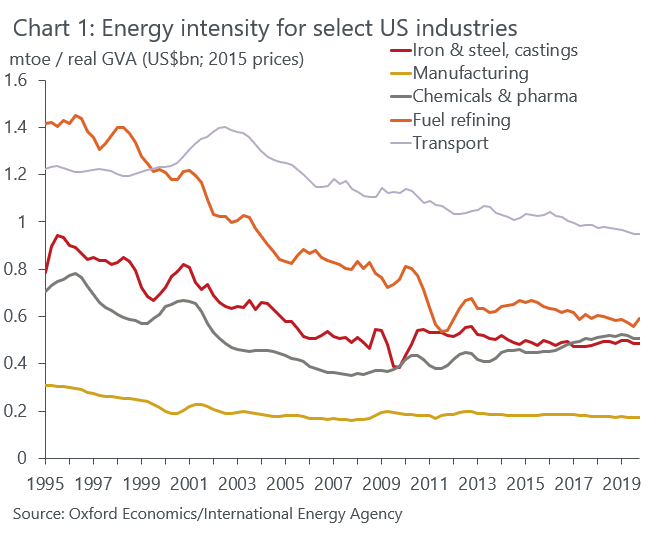
But this pattern of falling intensity has been happening within industries, too (see Chart 1), indicating that non-compositional factors have also brought down economy-wide intensity.
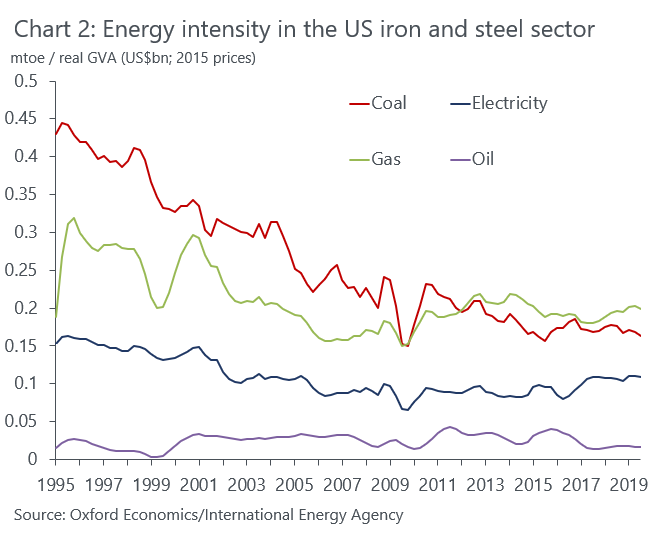
Within an industry, energy intensity can fall due to adjustments in the energy mix away from energy-intensive sources (like coal) and towards less energy-intensive sources (like electricity). However, given that intensity has fallen across the energy types, particularly between 1990 and 2010 (see Chart 2 for an example), it is likely that intensity fell over this period primarily owing to the adoption of more energy-efficient processes and technology, encouraged by energy-efficiency policies.
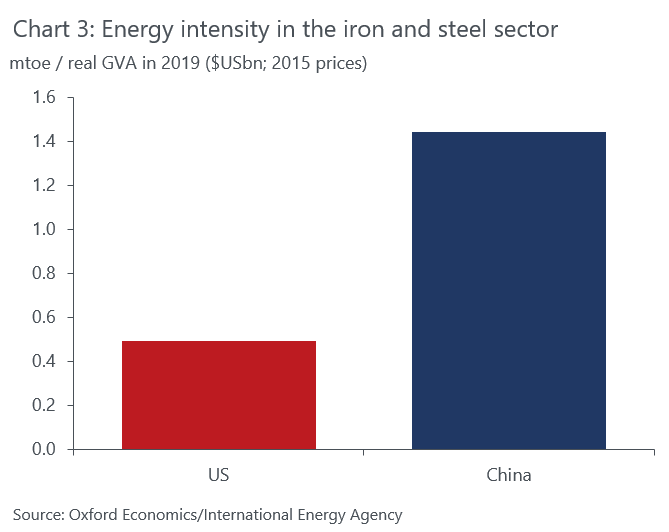
It could also be that the more energy-intensive aspects of production have been offshored to other countries, while domestic production has turned to higher value-added aspects of the supply chain. Chinese iron and steel production, for instance, is significantly more energy intensive than in the US (Chart 3).
We recently added a series of energy indicators to Oxford Economics’ Global Industry Service, allowing us to assess the prospects for energy demand, intensity, costs and carbon emissions on a sector-by-sector basis for 49 economies out to 2050. This rich set of energy history and forecast data, which draws upon data published by the International Energy Agency, opens the door to a new range of industry-level insights and analysis.Our new data reveal that there is considerable variation across sectors in terms of their energy intensity (see Chart 4). Within manufacturing, the most energy-intensive sectors tend to be coke and refined petroleum products, chemicals and pharmaceuticals, and iron and steel production.
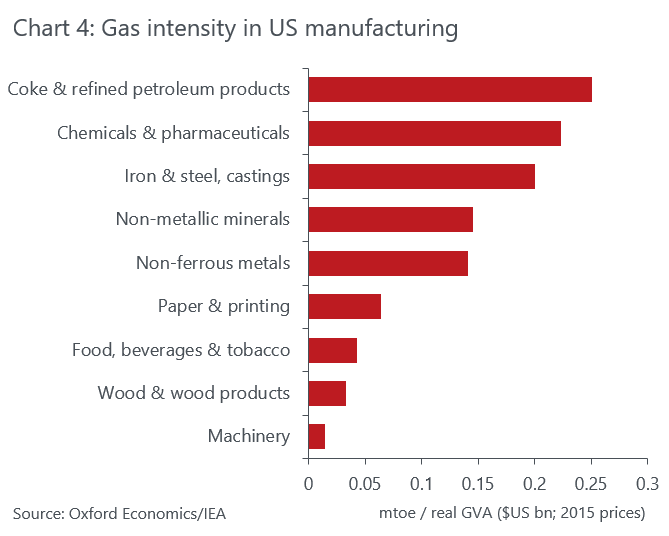
This sector-level detail can have important implications for the forecasting of aggregate energy demand trends. For instance, in the US, refining activities together with chemicals and pharmaceuticals account for 60% of manufacturing gas demand. Understanding gas demand trends in these specific industries can therefore provide a good steer on aggregate industrial gas demand dynamics.
It is worth noting that the pace at which intensity has fallen has slowed over the last decade, and in some rare cases has increased. For example, in the US chemicals sector, new supplies of cheap gas from shale formations have yielded a sharp increase in gas consumption in the sector from 2008/9 onwards, raising energy intensity (Chart 1).
But how do we expect energy intensity to evolve in the future?
In the near-term, elevated energy prices—particularly for electricity and gas—are likely to reduce economy-wide energy intensity in European economies, as energy-intensive sectors face surging costs and scale back production, and therefore reduce their energy usage. And a colder winter in Europe would require drastic cuts in gas consumption, which would pull down further on near-term intensity, though warmer-than-average weather at the outset of winter has reduced the likelihood of this outcome.
Over the long term, we expect energy intensity to continue falling across industries, as de-carbonisation policies will see industries reduce use of carbon-intensive fuels like coal and use more electricity, which is more energy efficient. In addition, energy-efficiency policies—such as new fuel-economy standards and smart metering—will also contribute to falling intensity as countries with net-zero targets aim to minimise energy demand growth.
Author

Tags: