How vulnerable are city economies to climate-related physical risks?


Around the world, efforts are being made to slow and eventually halt the process of climate change and reduce the social and economic threat it poses. Our various climate scenarios model that—globally, nationally, by sector, and for cities and regions. But what might happen if these goals aren’t reached?
Amongst our global scenarios we have examined a worst case, in which governments fail to meet their policy pledges to transition to net zero. The resultant high-emissions pathway causes higher average temperatures, but also greater temperature volatility and more frequent extreme heat events that cause severe physical damage. These increase over time.
We are now beginning to model the likely economic disruption that climatic events such as flooding, droughts, storms, and temperature anomalies (cold/heatwaves) might produce at the hyper-local level. To assess the economic risk, we are examining not only the natural vulnerability of local areas within different cities but also the amount of economic activity located in the streets and neighbourhoods in areas most at risk. We do this by combining global and sectoral drivers with bottom-up geospatial analysis, relying on techniques we have developed for translating satellite data, such as night lights from roads and buildings, into estimates of economic activity at a very granular local level.
Potential economic damage from riverine flooding in Hamburg
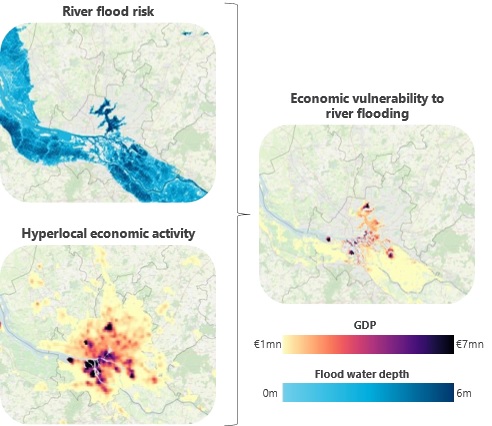
Source: European Commission/JRC, Oxford Economics
Take for example one of Germany’s leading cities, Hamburg, centred on the Elbe River and shown in the maps above. The city is significant to the German and European economies, and includes HafenCity, a riverside redevelopment that is one of Europe’s most ambitious regeneration projects. Our first map (top left) shows that some areas most exposed to flooding are along the river to the east and west of the city centre. As the bottom left map shows, the economic output associated with those localities is not high. However, the low-lying area to the north where the Alster lakes are located is also susceptible to riverine flooding—and that area produces a significant degree of economic activity. By combining these two metrics, our third map (right) shows where the greatest economic risks lie in a flooding event.
These techniques can be used to assess any town, city or region across the world where risks are less-well known, or less-well managed. By then connecting this analysis with economic activity we can help governments and organisations formulate plans to minimise losses and disruption from these coming realities.
Author

Tags: