Addressing climate change in Europe means taking a hyperlocal approach


The rising threat of climate change is challenging governments around the world. Previous research by colleagues at Oxford Economics concludes that global warming will reduce global GDP in 2050 by up to 7.5% of world GDP unless there are vastly more effective mitigation measures. That research also shows that these effects will vary dramatically across regions, and even within countries.
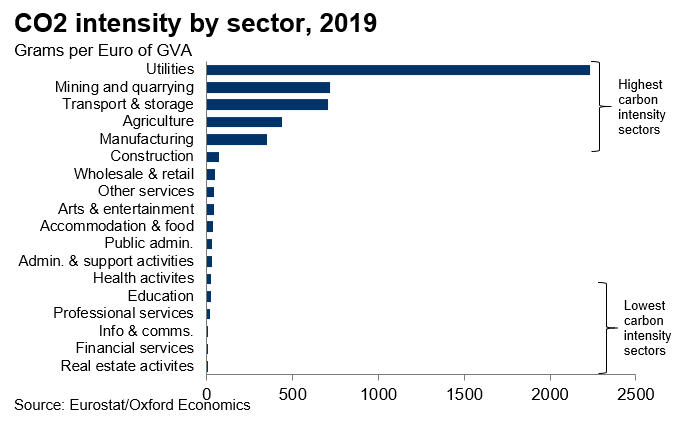
So how will the measures that need to be taken to reduce the impacts of climate change vary across geographies? Part of the answer to that question depends on the economic activities in which different locations specialise. As this chart shows, different sectors are responsible for very different amounts of harmful CO2 emissions. Places with large amounts of manufacturing, for example, will need to make greater adjustments than those that specialise in office-based services, or in hospitality or arts and entertainment, because manufacturing tends to generate more CO2, either directly through its own emissions or through the energy and raw materials it consumes.
To illustrate how the challenge varies by location, we have split Europe into its 30 largest cities, 70 medium-sized European cities, and the rest of Europe’s smaller cities, towns and rural areas. We have calculated the industrial structures of those areas, and organized them into the sectors with the highest CO2 or carbon intensity and those with the lowest. The results are shown in the next chart.
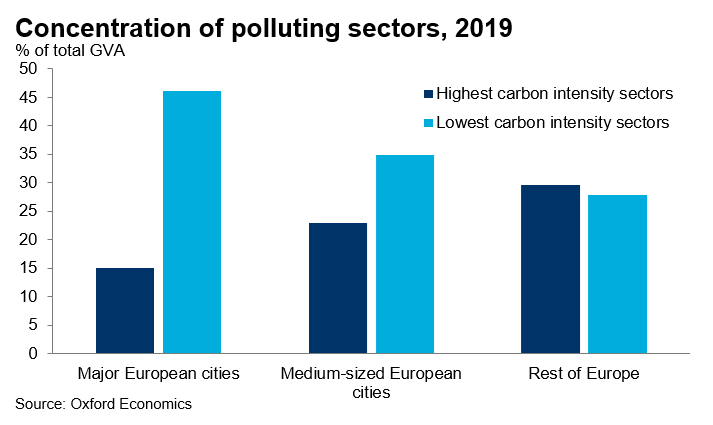
It is clear that, at least in Europe, cities are less reliant than other locations on high-carbon-intensive sectors and more reliant on sectors with low-carbon intensity—especially so for the economically largest cities. This suggests that Europe’s top cities may need to make fewer adjustments to reduce their carbon footprint than other places. This is potentially important for investors who may be concerned about the costs of climate adjustment and which cities may offer the best returns, along with city planners and business executives.
Of course, there are many other factors to consider. On average, workplaces only account for about one-third of all carbon emissions—other sources include transportation, including motor vehicles and aviation, as well as residential emissions from homes. Identifying the carbon intensity of a city or town’s buildings and its transport system will therefore be hugely important when considering the scale of the adjustment challenges it faces. A full analysis would look at a range of climate threats, not just contributions to CO2 emissions.
Even so, the sectoral structure is undoubtably part of the story, and so the type of analysis we have shown here, applied in more granular detail to individual cities globally, will help to benchmark the scale of adjustment each individual city needs to make.
Tags: