

Regional price adjustments offer a more nuanced view of consumer strength

Visit any London pub on a Friday evening and there’s a good chance that someone will be discussing the current price of a pint. According to The Standard, the latest estimates indicate that the average price in the UK capital has now reached an eye-watering £6.50. But head to Manchester, Madrid, Marseille, or Malmö, and the price of that same beer could look very different. There are, of course, multiple reasons for these differences, ranging from the taxes levied to different costs of raw materials and transport, but they highlight a broader point: the purchasing power of £1 is not the same everywhere.
Cost-of-living differences are therefore an important consideration, particularly following the higher inflationary environment of the past few years. While local incomes often reflect these differences—Oslo, for example, is famously one of the world’s most expensive cities, but its residents are also among the highest paid—this is not always the case. In turn, this can make cross-city comparisons difficult, as different income levels can translate into substantial disparities in purchasing power.
The challenge for analysts and economists alike is how to best capture these price level differences. The purchasing power of a local market tells a more meaningful story than nominal incomes or spending alone—and it’s also a better gauge of living standards. The standard approach for this has been to use Purchasing Power Parity (PPP) adjustments, developed by national statistics agencies. These are price-level conversion rates that capture how much of one currency is needed to buy the equivalent basket of goods and services in a different location.
For example, Eurostat’s 2024 PPP rate for the UK was 1.06. This means an average UK consumer needed £106 to buy the same basket of goods and services that would cost €100 across the EU27. However, converting €100 at the 2024 market exchange rate yielded only about £85, underscoring that the UK has a significantly higher cost of living than the EU average.
Therefore, applying this purchasing power adjustment to incomes reveals a very different picture of relative living standards. For example, an average disposable income of £27,900 in the UK has purchasing power equivalent to around €26,300 at EU27-average prices. This is higher than in France (€25,500), but below peers such as Germany (€31,600) and the Netherlands (€27,300).
Developing a measure of regional price differences
The concept of PPP adjustments is therefore an extremely useful tool, but there is still room for improvement. Namely, PPP is typically calculated at the national level, when consumer markets are often better understood at the city-level. After all, cost-of-living differences can be just as pronounced within a country as they are across countries.
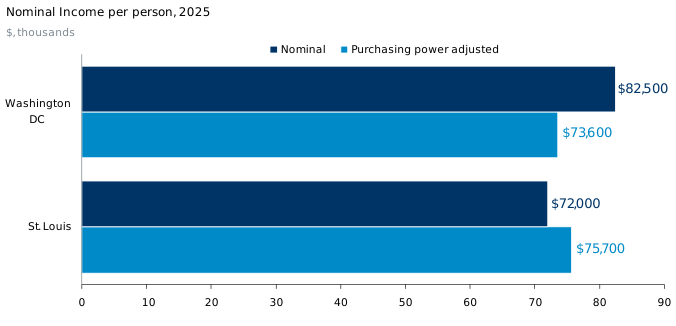
As one of the few countries that publishes regional price-level data, the US is a good example to illustrate this point. Washington, DC, is one of the most expensive metros in the country, with average prices 12% higher than the US average. This means that, while the average income of a Washington resident is high at $82,500 (in 2025), its purchasing power is much lower once this cost-of-living difference is factored in, equivalent to $73,600 at average US prices. On the other side of the spectrum, average incomes in a city like St. Louis, Missouri, are lower at $72,000 per person, but so too are average prices. Adjusted for purchasing power, an income of $72,000 here is equivalent to $75,700, which is actually marginally ahead of Washington, DC.
This might seem abstract, but the implication is important. Despite very different looking average pay packets, how far this income can stretch in each respective metro is almost identical, and St. Louis in this example emerges as a more attractive place to live and work than it might first seem. Regional price adjusting has therefore provided a much more nuanced end result.
Chart 1: Adjusting incomes based on PPP tells a very different story for Washington, DC, and St. Louisces
Sources: Oxford Economics, BEA
However, for the vast majority of countries, this type of city-level purchasing-power analysis is much more difficult because official data simply does not exist. To address this, we have been developing our own internal estimates of relative price-level differences between cities, adapting a methodology first explored by OECD researchers in 2019. We estimate the relationship between economic drivers—including income per person and housing costs as a share of total spending—and average price levels across US metropolitan areas. These relationships can then be used to predict relative price levels in other geographies, including European cities.
From our initial analysis, two key points emerge. The first is that the largest city in each country is in most cases by far the most expensive. For anyone who has lived in London or Paris, this may not be surprising, but what it does mean is that much of the income premium associated with working in these cities is usually offset by their higher costs of living. Adjusting income per person for differences in purchasing power suggests that the average Londoner or Parisian is not much better off than someone living in Edinburgh or Cambridge, or Toulouse or Nantes.
Our analysis also tells an interesting story about European convergence. As discussed in a recent research briefing, Central and Eastern European cities such as Warsaw and Prague have been, and are expected to remain, hotspots for consumer spending growth across Europe, thanks to booming local economies and rising incomes. While nominal incomes remain much lower than in Western Europe, the average PPP-adjusted incomes in these cities are now on a par with peers like Brussels, Lyon, and Bristol. This would have been almost unthinkable 20 years ago, and highlights the remarkable economic journey these cities have been on.
Chart 2: PPP-adjusted incomes in Warsaw and Prague are much closer to many Western European
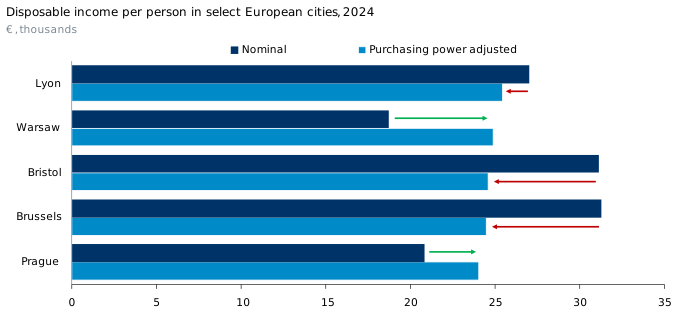
This isn’t to say that living standards in Warsaw and Prague have fully converged to those of Western cities, as there are many other components that contribute to quality of life alongside incomes and spending power. But what it does highlight is how economies have evolved over time, and how our understanding of living standards at the city level can be enhanced. For companies looking to understand their markets, a regionally adjusted PPP series may offer a more nuanced, and often more useful, picture.
Request a free trial
Complete the form and we will contact you to set up your free trial. Please note that trials are only available for qualified users. We are committed to protecting your right to privacy and ensuring the privacy and security of your personal information. We will not share your personal information with other individuals or organisations without your permission.