2026 Global Cities Index
About the index
What the index measures — and why it matters
By looking at a range of socio-economic indicators across 1,000 of the globe’s major cities, the Global Cities Index highlights the unique drivers of different cities’ strengths and provides a holistic assessment of performance.
For business leaders and policymakers alike, the index provides a powerful template for benchmarking performance, sizing investment opportunities and risks, and assessing structural differences across the globe’s key urban economies.
Because the index is built on our own city forecasts rather than historic data alone, it captures the direction of travel as well as the current standing of each city — which is what makes it usable for decisions with a long horizon: where to open a site, where to invest, where to prioritise policy.
While the global economy has trembled under a series of shocks in recent years, there has been substantial resilience — many markets have delivered significant returns for investors able to weather short-term dislocations.
Oxford Economics, Global Cities Index 2026
METHODOLOGY
Five categories, one holistic score
The Oxford Economics Global Cities Index is a holistic ranking of the 1,000 cities included in our Global Cities Forecasting Service. While our best-in-class economic forecasts underpin these rankings, cities are scored across five different categories to achieve a well-rounded comparison of locations.
Each category is indexed 0–100, where 100 is the strongest performer in the dataset, and the five combine into a single overall score. Select a category below to see how it is built.
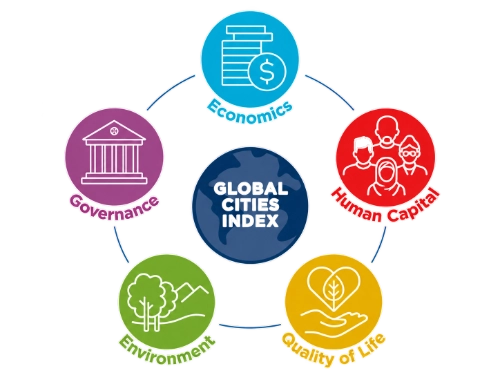
 Economics
Economic size, structure and growth potential.
 Human Capital
Talent, skills and labour force strength.
 Quality of Life
Wellbeing, liveability and access to amenities.
 Environment
Environmental quality and sustainability.
 Governance
Institutional strength and civic effectiveness.
Economics
A city’s economy plays a crucial role in its prosperity and attractiveness. Economic vitality is a fundamental aspect of urban development, driving a city’s wealth generation, employment opportunities, access to goods and services and much more. Our Economics category allows for an assessment of a city’s potential for sustained growth and development.
We assess the economic size, structure and growth of each city, examining both historical performance and future potential.
Human Capital
A city’s people are its most valuable asset. The Human Capital category captures the depth, quality and dynamism of the workforce and talent base that underpin long-term competitiveness — from skills and education to the strength of the labour market.
This category assesses the scale and quality of a city’s talent pool, and its capacity to attract, develop and retain skilled people.
Quality of Life
Quality of life encapsulates the wellbeing and satisfaction of a city’s residents, reflecting the intersection of various socioeconomic factors. This category provides insights into the liveability and attractiveness of a city, which can play a role in migration patterns, talent retention and the overall happiness of residents.
We assess the benefits of living in each city and residents’ wellbeing, covering financial and health outcomes as well as access to amenities.
Environment
The environmental performance of a city increasingly shapes both resident wellbeing and long-term resilience. This category assesses how well a city balances growth with environmental stewardship, and its exposure to environmental risk.
We assess environmental quality, sustainability and resilience factors relevant to each city’s long-term outlook.
Governance
Strong governance underpins a city’s ability to plan, invest and deliver for its residents and businesses. This category captures the institutional quality, stability and effectiveness that shape a city’s operating environment.
We assess the strength of civic institutions, regulatory quality and the stability of the operating environment.
City Archetypes – a new way to classify cities
Each city is unique in its structure, outlook and history. But in many cases, cities evolve along similar development pathways, sharing characteristics, challenges and opportunities with other cities around the world. To help classify these cities and their shared traits, we have created a typology of city archetypes to allow decision-makers to compare and monitor the performance of similar cities.
The archetypes have been defined using a range of metrics from all five categories of the Global Cities Index, with each archetype focusing on a different set of common traits. Some of the world’s largest and most prominent cities like New York, London and Tokyo belong to more than one classification, reflecting the multifaceted nature of these cities. But the typology is not exhaustive, and as a result many cities do not fall into any archetype. By design, the archetypes are meant to cover as wide a range of cities as possible, ranging from small island nation capitals to economic behemoths, from developing-country megacities to highly specialised hubs in advanced economies.

Global Leaders
21 cities
The true “global cities” that drive the world economy. They are the largest cities in the world by GDP, and are financial and business hubs with many corporate headquarters and universities.

Regional Leaders
66 cities
Important and large cities in their regions, but not as economically powerful on the global stage as the Global Leaders. They outperform their respective countries on metrics such as economic growth and income per person, and tend to have more universities and business activity than neighbouring cities.

Cultural Capitals
63 cities
Mostly smaller cities that have high quality of life. They have many cultural sites and a sizeable share of foreign-born residents. They tend to attract residents and tourists alike due to their amenities and educational opportunities.

Sustainable Cities
63 cities
Cities that have prioritised sustainable growth and are focused on adapting to and mitigating the effects of climate change. They have low emissions intensities and are focused on the clean energy transition, with the political stability to support their climate goals.

Industrial Hubs
51 cities
Cities dependent on extraction or manufacturing to drive growth. They tend to have low economic diversity and experience volatile growth due to the nature of their key industries. These cities often have high emissions intensities.

Legacy Cities
50 cities
Cities facing a demographic challenge from ageing (and falling) populations. As a result, GDP growth is slowing or stagnant and they often struggle to attract immigrants, leading to a low share of foreign-born residents.
Developing Megacities
25 cities
Very large urban areas (over 10 million residents) in the developing world. Their infrastructure investments have often struggled to keep up with the increasing population and they have low levels of income per person.

Emerging Standouts
56 cities
Cities in the developing world that are outperforming their respective countries. They attract residents due to their fast productivity growth and higher levels of income per person than their country as a whole.
The Global Leaders are the highest scoring cities
In both the Economics and Human Capital categories, the Global Leaders unsurprisingly emerge as the strongest performers, reflecting their economic prowess and their abundance of well-educated, productive workers. Although Global Leaders excel in Quality of Life, they are outperformed by the smaller Cultural Capitals, which, while not as economically dominant, offer a higher quality of life for residents. Sustainable Cities achieve the highest scores in both the Environment and Governance categories, underscoring their commitment to environmental priorities and the robustness of their institutions.
- Global Leaders 85.9
- Cultural Capitals 73.6
- Sustainable Cities 68.4
- Regional Leaders 65.7
- Developing Megacities 46.4
- Legacy Cities 44.6
- Industrial Hubs 39.7
- Emerging Standouts 33.1
- Global Leaders 78.9
- Cultural Capitals 61.2
- Regional Leaders 60.6
- Sustainable Cities 55.3
- Developing Megacities 49.1
- Emerging Standouts 40.0
- Industrial Hubs 36.6
- Legacy Cities 32.0
- Global Leaders 74.6
- Regional Leaders 61.4
- Cultural Capitals 56.4
- Developing Megacities 52.2
- Sustainable Cities 51.6
- Industrial Hubs 40.4
- Emerging Standouts 29.8
- Legacy Cities 24.2
- Cultural Capitals 85.6
- Global Leaders 82.4
- Sustainable Cities 80.3
- Legacy Cities 76.1
- Regional Leaders 68.5
- Industrial Hubs 56.8
- Developing Megacities 50.1
- Emerging Standouts 42.0
- Sustainable Cities 77.7
- Global Leaders 74.1
- Cultural Capitals 72.6
- Regional Leaders 68.1
- Legacy Cities 65.6
- Developing Megacities 58.0
- Emerging Standouts 55.0
- Industrial Hubs 54.5
- Sustainable Cities 86.1
- Cultural Capitals 84.4
- Global Leaders 79.5
- Legacy Cities 78.6
- Regional Leaders 65.9
- Emerging Standouts 55.0
- Industrial Hubs 48.6
- Developing Megacities 42.4
Average Global Cities Index score by archetype, 0–100. Source: Oxford Economics Global Cities Index.
Where each archetype goes next
In addition to enabling a comparison of peer cities across different structural characteristics and index results, the archetypes also provide a useful lens through which to view the key themes and trends that will shape the future of cities. Some of these trends will provide opportunities for cities to increase economic growth and elevate the quality of life of their residents through a more sustainable future. But others will be more challenging to navigate, risking the progress many cities have made in the past few decades.
| Archetype | Key opportunity | Key challenge |
|---|---|---|
| Global Leaders | Generative AI: a conducive regulatory environment and skilled workforce can maximise the productivity benefits of this emerging technology. | Rising inequality: the gap between the highest and lowest income groups has been rapidly growing in recent years, threatening social cohesion. |
| Regional Leaders | Alternative to Global Leaders: with cheaper housing and business costs, these cities can position themselves as alternatives to the Global Leaders and attract new residents and business investment. | Deglobalisation and trade wars: with reduced access to large markets in other countries (among other positive benefits of free trade), growth and innovation may both take a hit. |
| Cultural Capitals | Attracting new residents: promoting high quality of life and access to amenities can attract new residents and act as a template for other cities. | Housing affordability: regulations limiting housing supply combined with strong demand for accommodation from both tourists and residents may lead to significant pricing pressures. |
| Sustainable Cities | Clean energy transition: by taking the lead in reducing emissions and transitioning to cleaner energy, these cities are well positioned to benefit from the green economy of the future. | Climate hazards: many of these cities are vulnerable to sea level rise or other climate hazards, which will only worsen unless the rest of the world joins in the clean energy transition. |
| Industrial Hubs | High-tech and green industry: leveraging existing infrastructure and logistics capabilities can maintain a competitive advantage while investing in the production of semiconductors, EVs, and other green economy goods. | Clean energy transition: the move to renewable energy sources threatens the viability and profitability of traditional oil and gas and heavy manufacturing operations. |
| Legacy Cities | Urban revitalisation: repurposing former industrial spaces and vacant downtown areas into new cultural districts, parks, and other mixed-use spaces can attract new residents and improve quality of life. | Declining populations: inward migration is insufficient to offset the population losses through low fertility rates, leading to ageing and falling populations and stagnating economic growth. |
| Developing Megacities | Human capital potential: with massive, young workforces, these cities have the potential to realise huge demographic dividends. | Rapid urbanisation: infrastructure investments are unable to keep up with large and rapidly growing populations, leading to various quality of life and productivity issues. |
| Emerging Standouts | Productivity growth: significant increases in productivity over the coming years can lead to substantial improvements in incomes and overall quality of life of residents. | Institutional instability: rapid population growth and rising inequality affect resident quality of life and may threaten the stability of the government and institutions. |