Research Briefing
| May 8, 2024
US Inflation expected to be highest in Southern metros
We have recently added CPI estimates for selected major metros in the US to our US Cities and Regions Service. They shows notable historical variations in inflation between US cities. These differences have widened since 2020, coinciding with the period of high inflation nationally. As US inflation eases in our forecast, we expect metro inflation to return to historical trends relative to the US.
What you will learn:
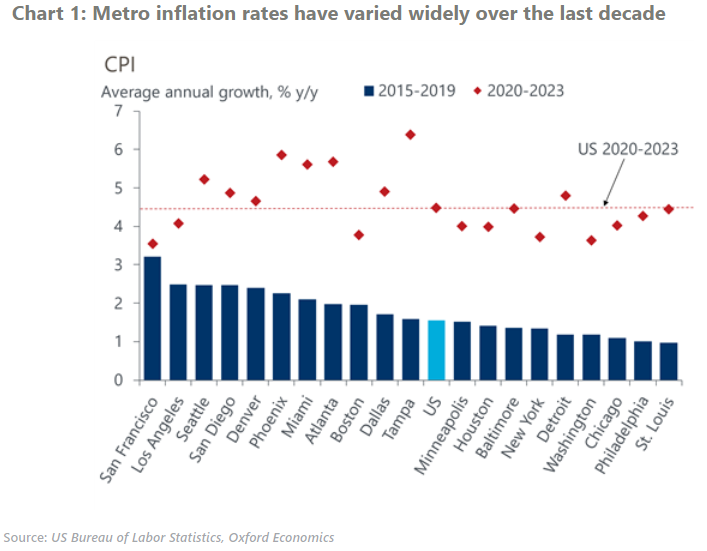
- Metros that had higher inflation than the US average from 2015-2019 tended to be in the Pacific, Southwest, and South regions, including places like San Francisco, Phoenix, and Miami. Metros that saw lower than average inflation from 2015-2019 were generally in the Northeast and Midwest, such as New York and Chicago.
- The data suggest a key driver of the path of metro inflation since the Covid-19 outbreak has been net migration trends. Areas in the South and Southwest have seen greater in-migration and higher population growth since 2020. The resulting higher demand for housing has likely fueled the sharp rises in housing costs, leading to a greater acceleration in inflation in these areas.
- San Francisco and Los Angeles are exceptions in that they had above average inflation from 2015-2019, but with muted acceleration since 2020, their 2020-2023 inflation rates have fallen below the US average.
- Metros in the Pacific, Southwest, and South are forecast to see higher than average inflation. We expect San Francisco and Los Angeles to return to above average inflation as population effects since the Covid-19 outbreak reverse.