
US Industry Service
Outlook for more than 250 detailed sectors in the NAICS classification, including industrial, technology, transportation, business services, entertainment, and composites and aggregates. Key indicators include output, prices, CapEx, OpEx and profits.
Try for free
Overview
Our unique techniques of integrated modelling enable us to translate how macroeconomic developments affect demand, supply, and investment trends across multiple sectors, in a consistent way. This provides clients with a unique tool for long-term strategic planning, risk analysis and assessment of US sector trends and opportunities.
An insightful suite of services
Our US Industry Service provides forecasts and historical data for a comprehensive understanding of the US economic structure and its evolution over time.
Rigour and accuracy
Oxford Economics has a stringent and rigorous forecasting process to ensure full consistency and integration with macroeconomic conditions.
Timely updates
Our forecasts are updated quarterly, using the latest macroeconomic and sectoral data.
Benchmarking
Analysis of the outlook for the sectors you purchase from and sell to under alternative economic scenarios allows you to benchmark corporate performance.
Extensive sectoral coverage
The service covers more than 250 sectors and features a data dashboard that provides key metrics and tracking charts for each individual sector. In addition, a quarterly report highlights the factors underpinning the forecasts across the major headline sectors.
A comprehensive service
Our service allows you to make informed decisions thanks to rigorous and consistent data and the tools and the support necessary to interrogate the data.

Making your job easier
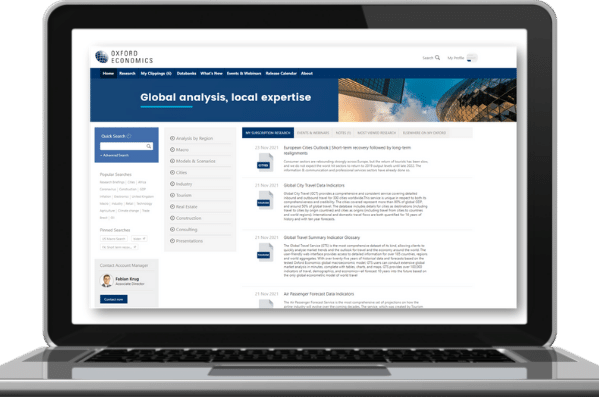
Our interactive databanks and dashboards put key metrics at your fingertips, allowing you to quickly find the information and analysis you need.

Service features
Forecasts and historical data for more than 250 industries.
Our service follows the NAICS industrial classification. Updated quarterly, drawing on our baseline macroeconomic forecasts for the US and global economies, and our global industry forecasts.
Analysis of key drivers and our forecast outlook.
Coverage
Our service covers key economic indicators for more than 250 industries across multiple sectors:
- Mining
- Machinery manufacturing
- Electronics and electrical
- Transportation equipment
- Metals, construction materials, furniture
- Non-durables manufacturing
- Utilities
- Construction
- Distribution and accommodation
- Transportation by mode Information and communications
- Financial and real estate
- Business and professional services
- Public, education, and health care
- Recreation and entertainment
Indicators include gross output, value-added, CapEx, OpEx, prices and profits. Fill out the form to request more information about the service and its coverage.

United States Industry Service
The US Industry Service features historical data and forecasts for 261 individual industries, which together comprise the entire US economy.

“Oxford Economics’ data and forecasts form the backbone of our demand models. The global consistency and granular detail available in their expansive dataset allows us to focus on the variables most relevant to our business.”
Resources and events

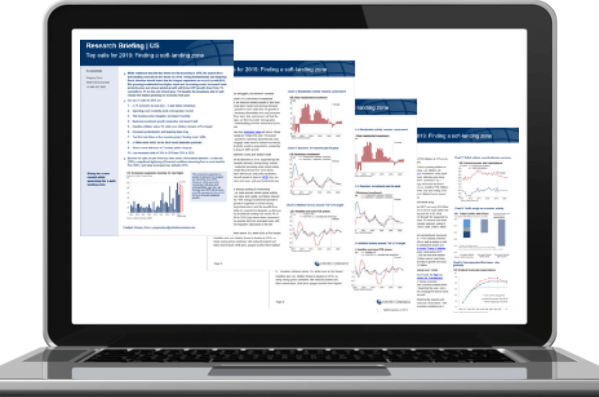
Research Briefing
US and Canada housing affordability edged down in Q3
Research Briefing
United States recoveries in 2022 are inversely proportionate to 2020 declines

Research Briefing
US Recovery Tracker drops on Omicron and seasonal drags

Research Briefing
United States Recovery Tracker surpasses its pre-Covid level

Event
Olivier Blanchard at our annual New York conference

Webinar
Will overtourism problems return for cities?

Webinar
Global construction sector continuing to rebound in 2022

Webinar
Air travel recovery to resume in 2022 post-Omicron
United States 2022 Themes: A ‘MESSI’ year ahead
Featured
Request a Free Trial
Complete the form and we will contact you to set up your free trial. Please note that trials are only available for qualified users.
We are committed to protecting your right to privacy and ensuring the privacy and security of your personal information. We will not share your personal information with other individuals or organisations without your permission.
Download the brochure for United States Industry Service
DownloadRelated services

Service
Global Industry Service
Gain insights into the impact of economic developments on industrial sectors.
Find Out More
Service
US Construction Service
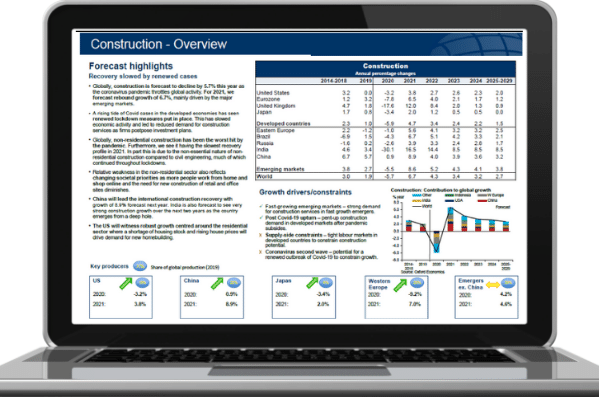
A comprehensive five-year outlook for construction activity in the United States.
Find Out More
Service
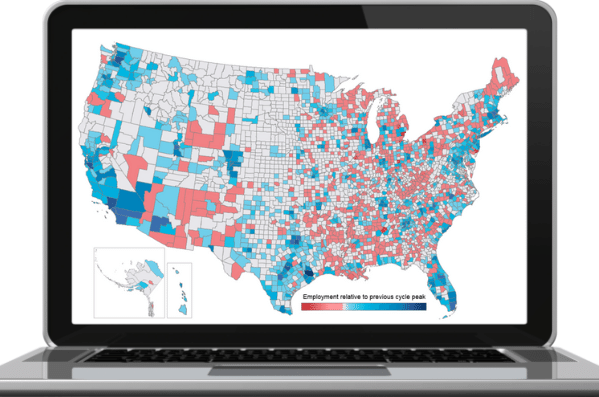
US States and Metro Service
Forecasts, scenarios and analysis for US states, metropolitan statistical areas and counties.
Find Out More
Service
US Forecasting Service
Access to short- and long-term analysis, scenarios and forecasts for the US economy.
Find Out More
Service
Global Sustainability Model
Accurately measure your organisation's global footprint through economic, environmental and social lenses, identify risks and develop strategies to become more sustainable.
Find Out MoreTrusted By